Analysis by Akash Dubey
Group Members: Charles Tang, Nathaniel Correa, Akash Dubey, and Khang Nguyen
Project Overview
For our Honors College Forum Social Impact Plan, our group aimed to improve traffic efficiency at Rutgers New Brunswick. Since the primary form of transportation for students is the Rutgers bus system, we conducted an extensive analysis of bus transit data to identify patterns, optimize routes, and improve service reliability.
View Repository | Interactive Map
Data Collection Process
I developed a custom Python script to collect real-time bus data from the Rutgers PassioGO system:
- Polled the PassioGO API every 30 seconds
- Contributed to the PassioGO API with this pull request
- Hosted on Azure VM for reliable 24/7 operation
- Collected over 100MB of structured transit data
- Gathered approximately 300,000+ data points over one week
Key Visualizations
Route Load Analysis

LX Route Analysis

Route Loop Times

Bus Capacity Analysis

Weekly Operations

Speed Analysis

Interactive Visualization
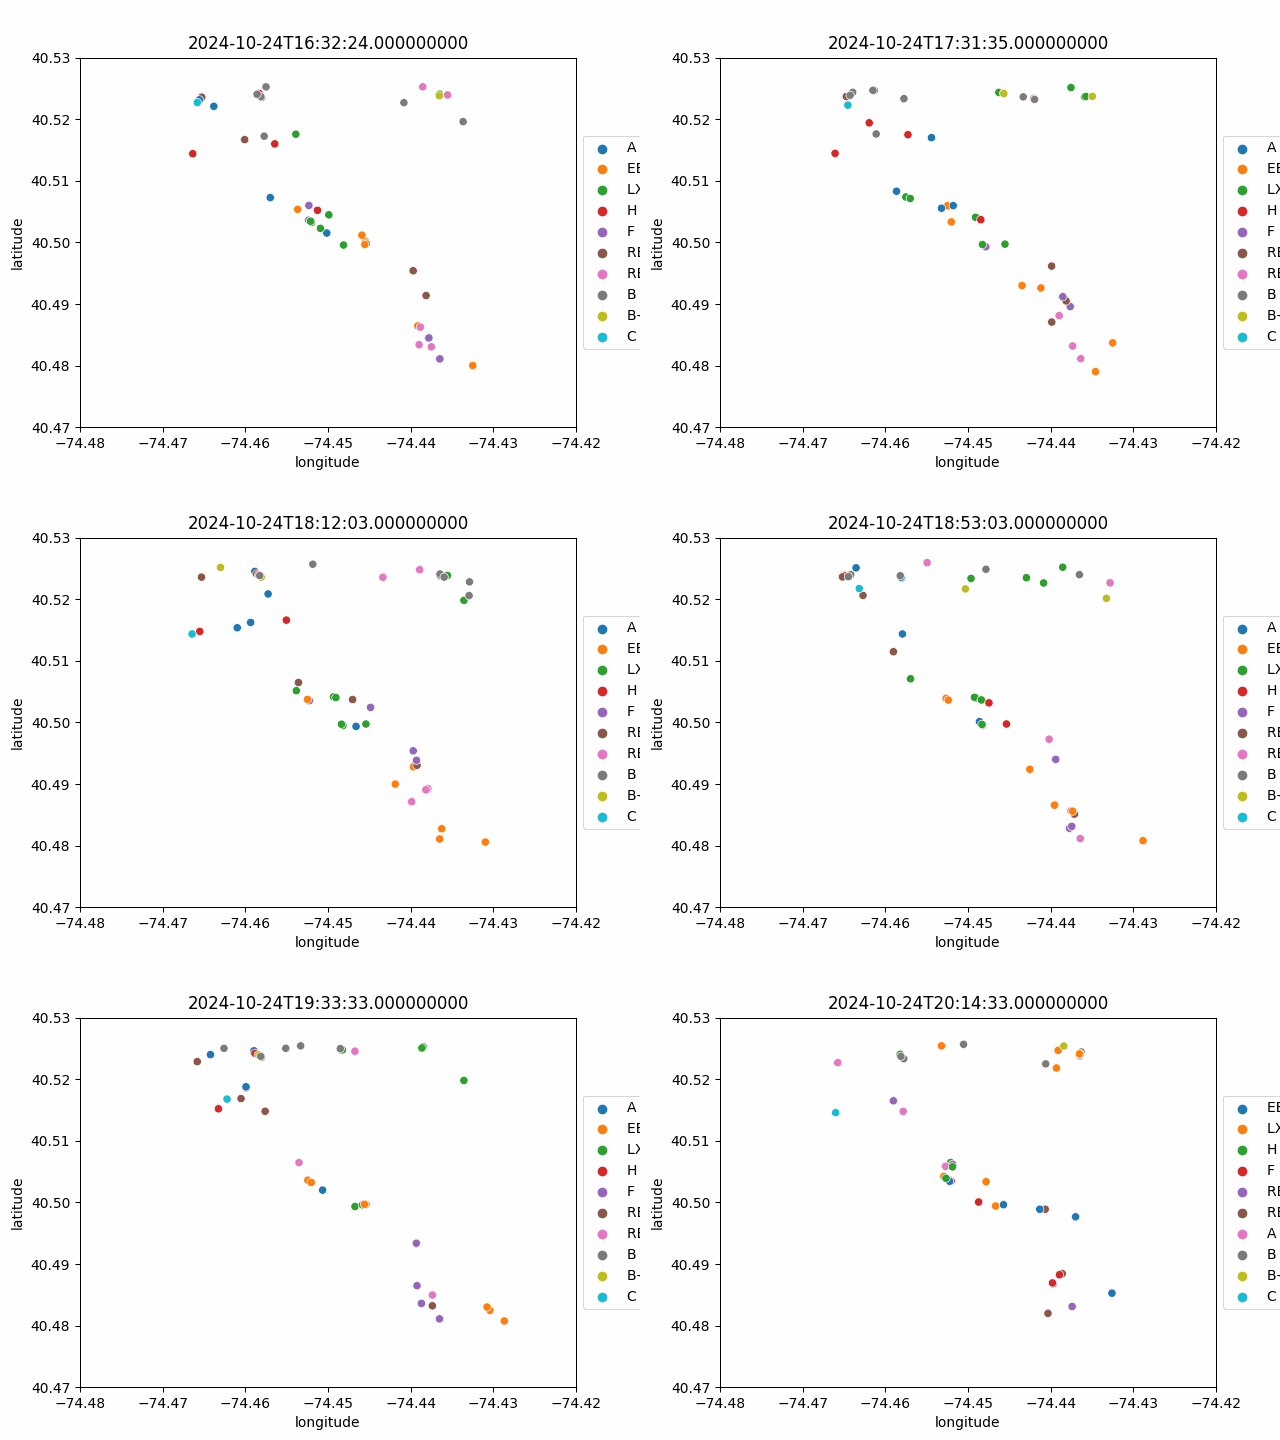 *Real-time visualization of bus movements across campus*
Key Findings
- Peak wait times correlate with class change periods
- Route efficiency varies significantly by time of day
- Load patterns follow predictable daily cycles
- Identified optimal bus distribution patterns
Technologies Used
- Python 3.11
- Data Analysis: Pandas, NumPy
- Visualization: Matplotlib, Seaborn, Folium
- API Integration: Requests
- Cloud Infrastructure: Azure VM
Future Improvements
- Real-time prediction model for wait times
- Interactive web dashboard
- iOS and Android apps for real-time tracking
- Machine learning for route optimization
- Weather impact analysis
This project demonstrates the power of data analysis in improving public transit systems and enhancing the student experience at Rutgers University.
Note: This project is for research and analysis purposes only and is not officially affiliated with Rutgers University.