
HiC-TAD-Library — 3D Genome Analysis & AI-Powered Enhancer Design
Your DNA isn’t just a linear sequence—it’s folded into a precise 3D architecture that controls which genes get turned on, in which cells, at which times. The fundamental units of this architecture are Topologically Associating Domains (TADs): megabase-scale chromosomal neighborhoods where DNA sequences interact far more with each other than with the rest of the genome. When TAD boundaries break down—through mutations, deletions, or structural rearrangements—genes can come under the control of the wrong enhancers, often with catastrophic consequences. This project is a comprehensive Python library for visualizing and analyzing that architecture, extended with Google DeepMind’s AlphaGenome AI for predicting what happens when you delete specific genomic sequences.
Visualizing TAD Architecture
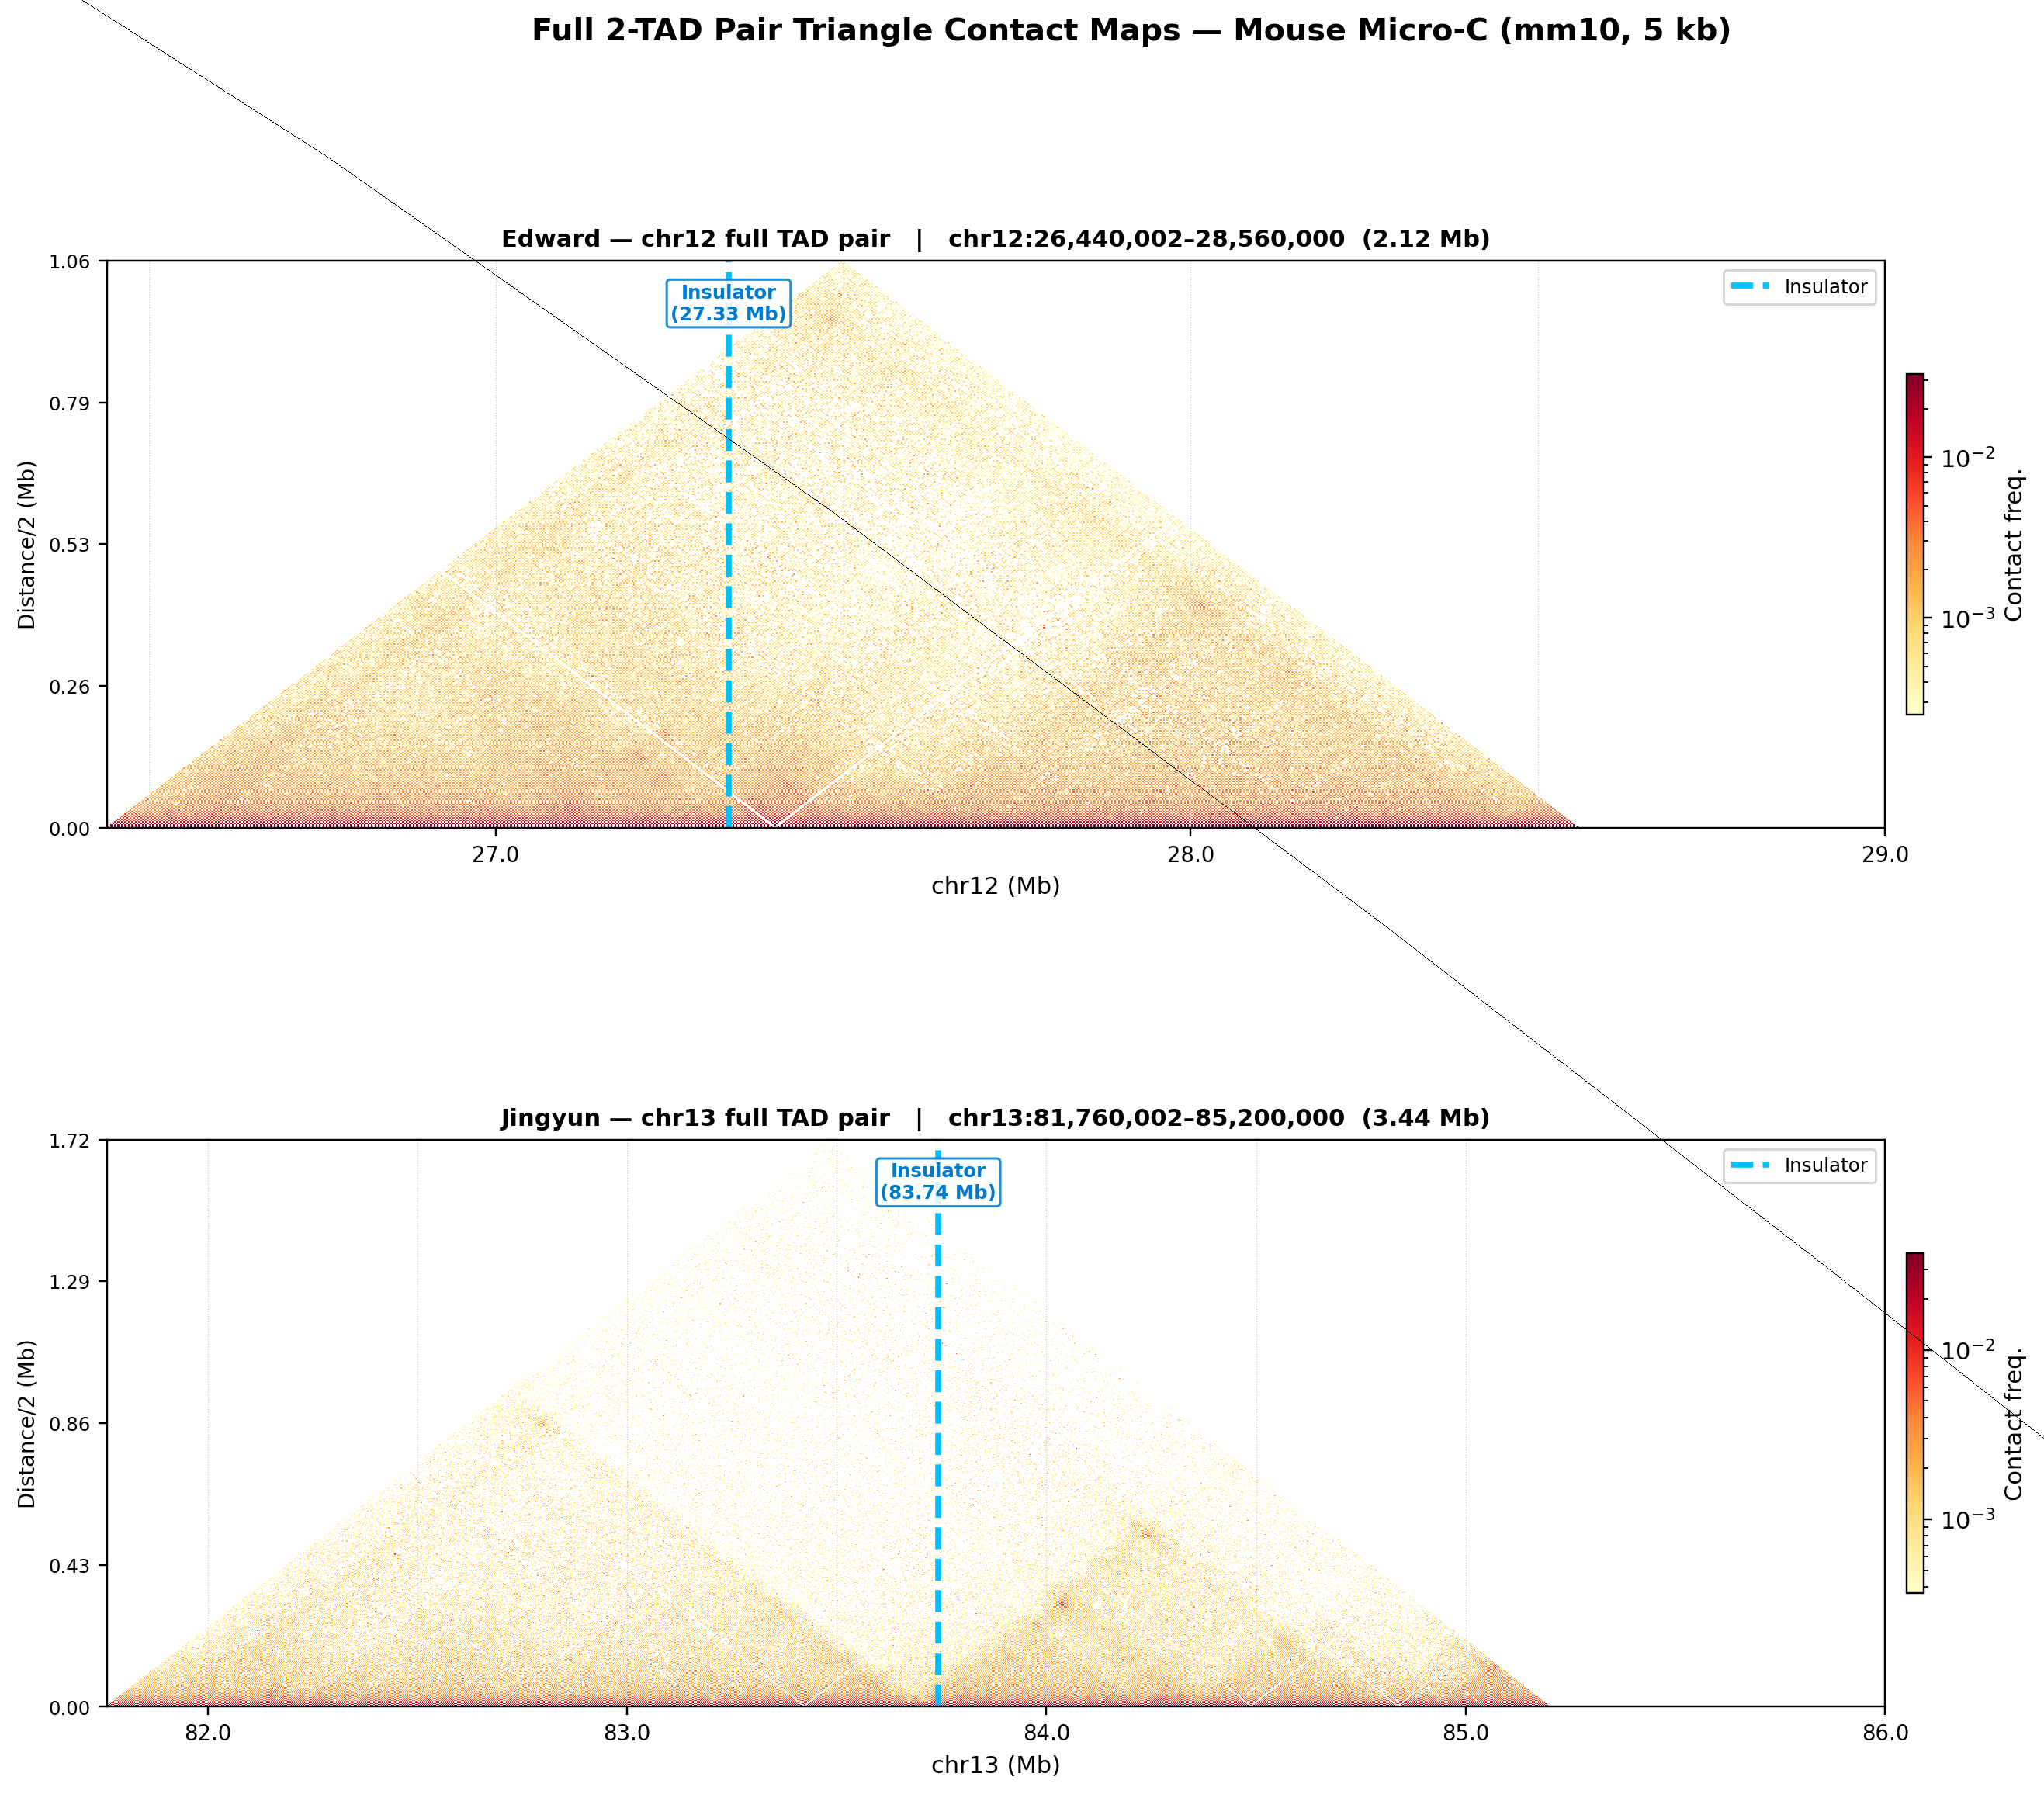
The entry point is a suite of Hi-C contact map visualizations built on real Mouse Micro-C data (mm10, 5 kb resolution from 4DNucleome). The triangular heatmaps above show the two genomic regions studied—Edward’s insulator on chr12 and Jingyun’s insulator on chr13—with the suspected insulator position marked in cyan. TADs appear as warm-colored triangles: regions where genomic loci interact intensely with their neighbors but are insulated from the loci next door.
The library generates square contact heatmaps, triangular views, insulation score tracks, directionality index profiles, and boundary strength visualizations—all from a single cooler/mcool file input.
Multi-Scale Boundary Detection
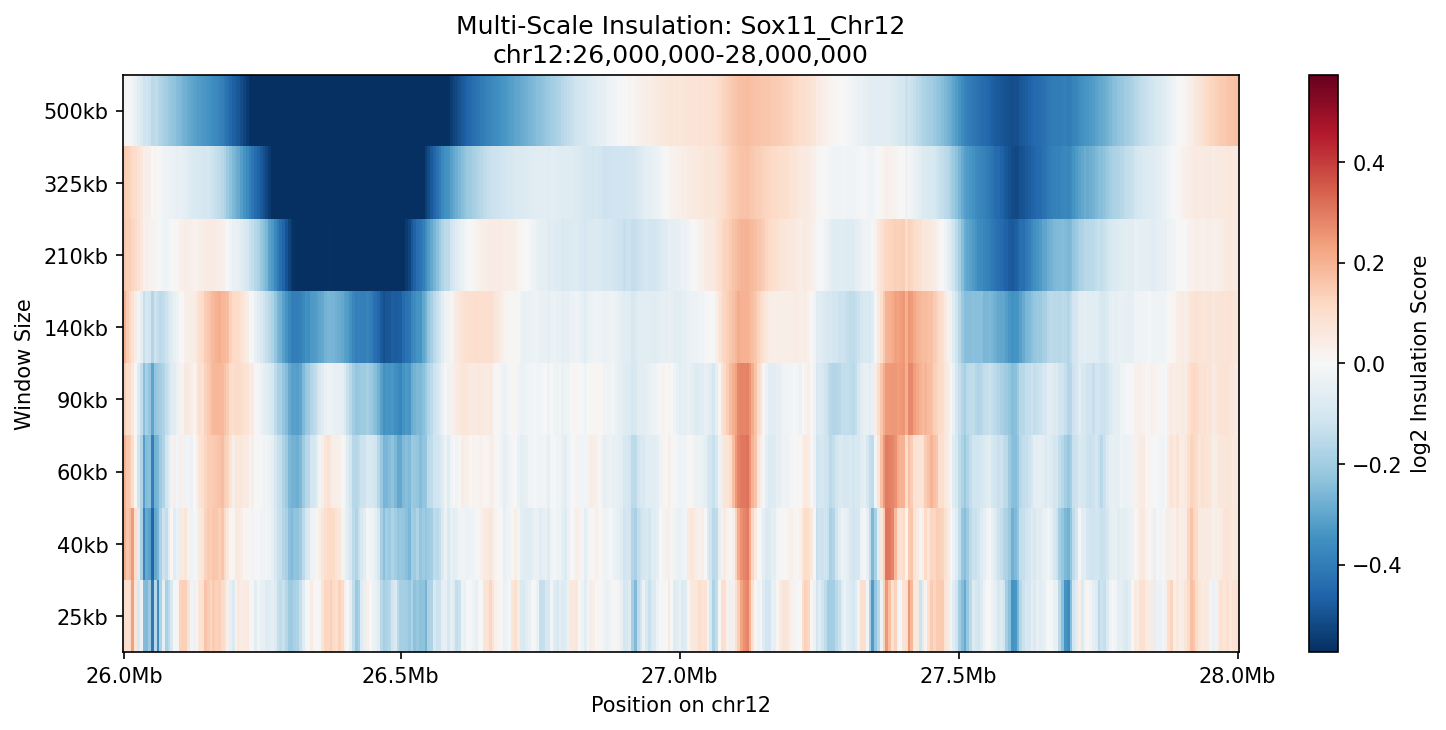
A TAD boundary that only appears at one spatial scale might be a noise artifact. Constitutive boundaries—the ones that truly compartmentalize the genome—persist across a wide range of window sizes. This multi-scale insulation heatmap sweeps from 25 kb to 500 kb window sizes, revealing which boundaries (vertical blue streaks) are robust and which are scale-dependent. Strong, persistent boundaries appear as deep blue columns running from top to bottom; weak or nested boundaries only emerge at fine scales.
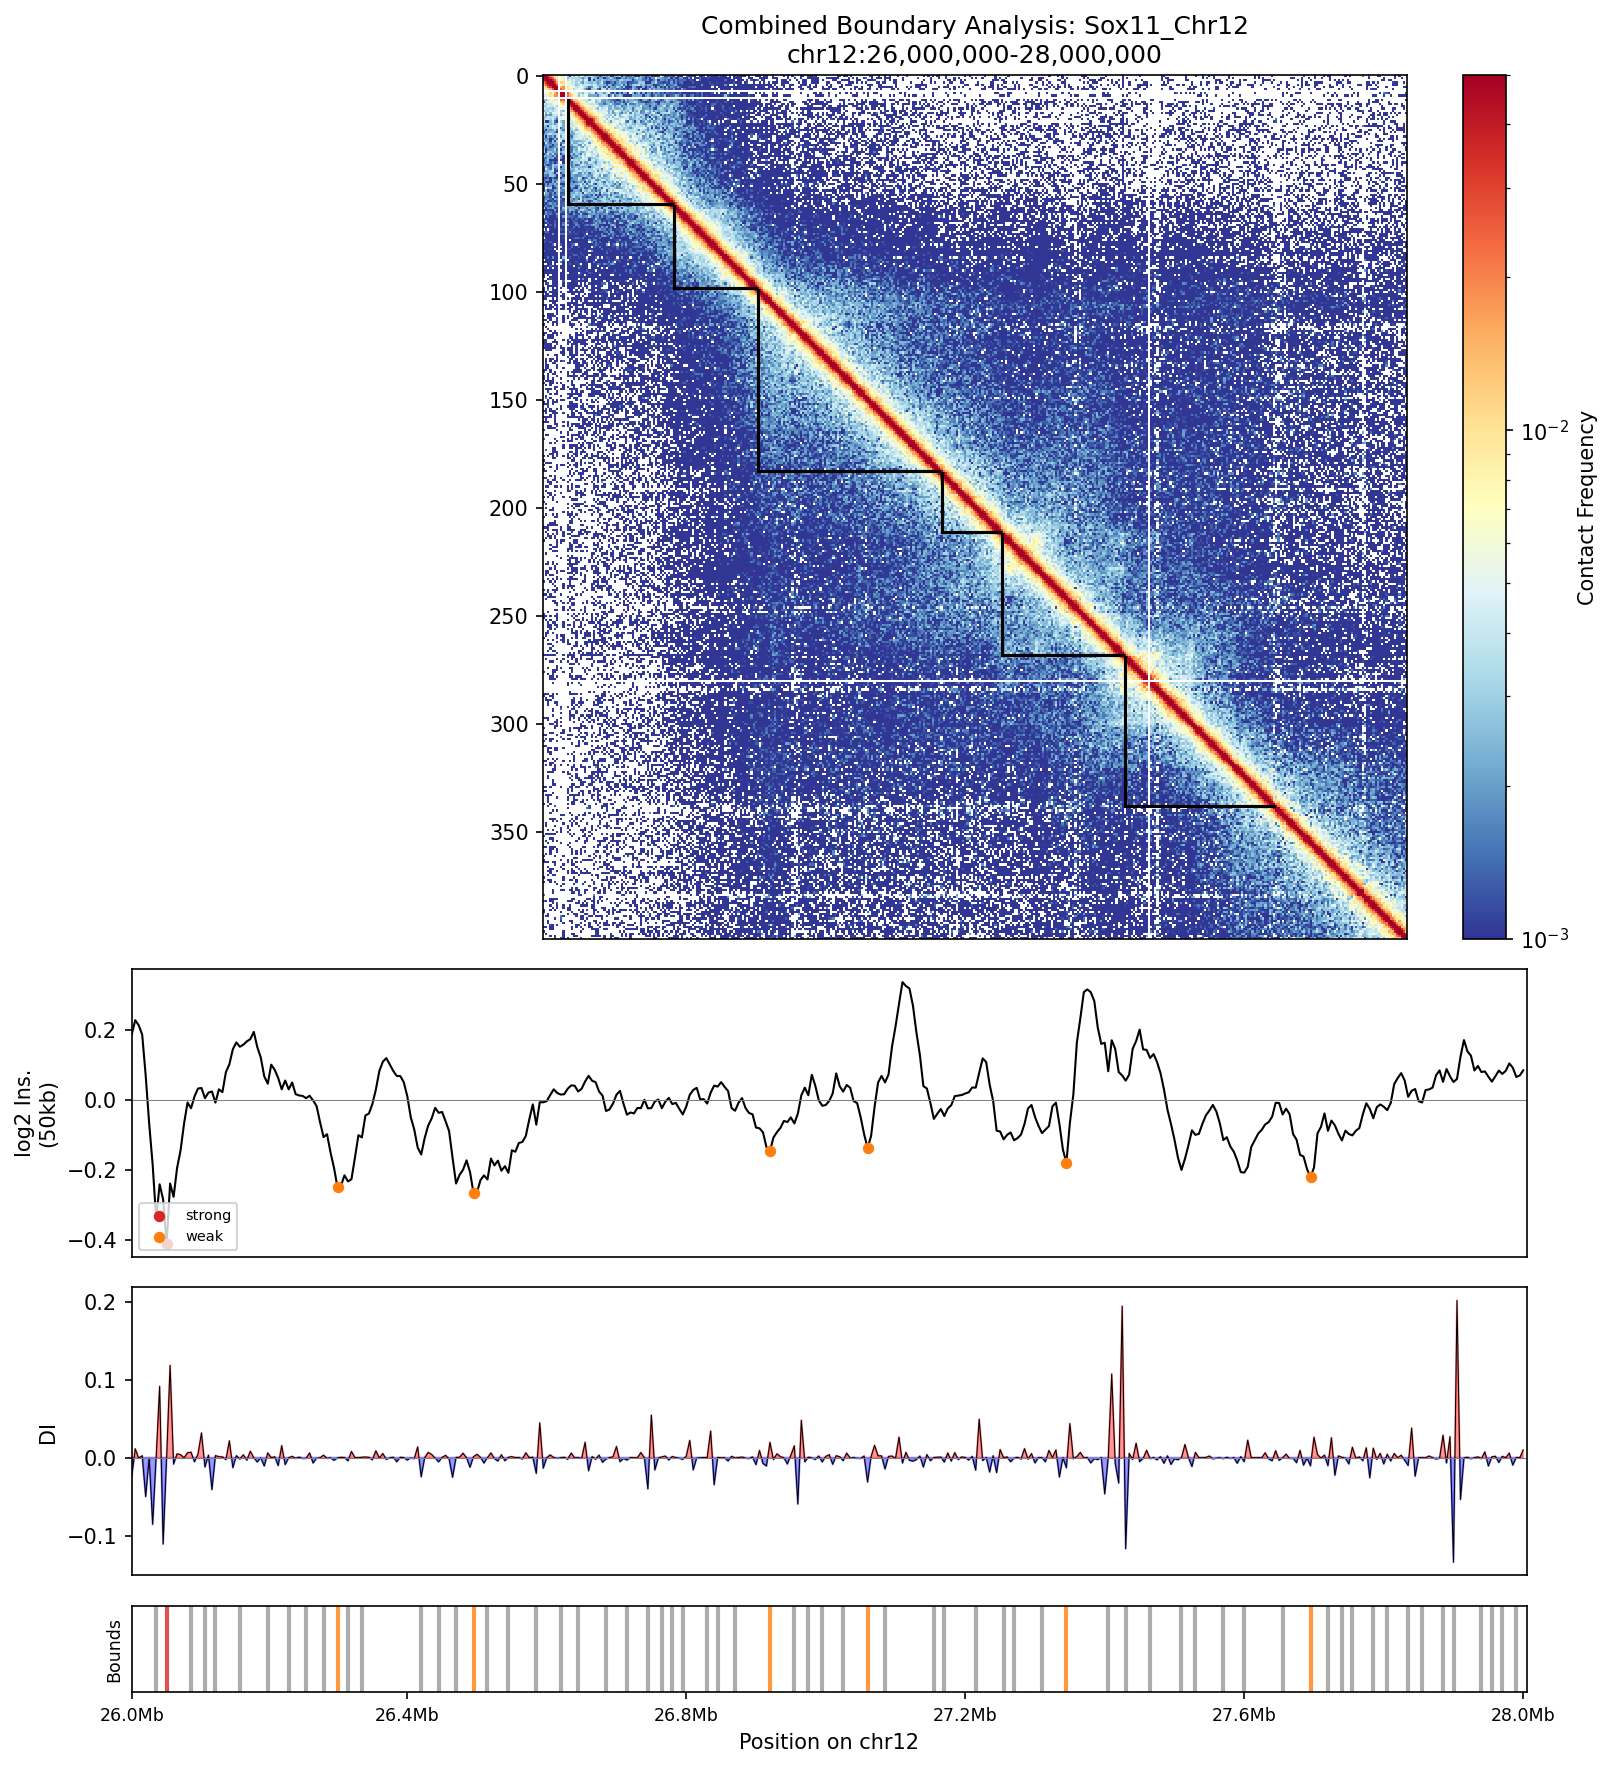
The combined boundary analysis (hero image) overlays the contact matrix with called TAD intervals, the insulation score track, and the directionality index—three independent signals that converge on the same boundary positions.
3D Polymer Simulation
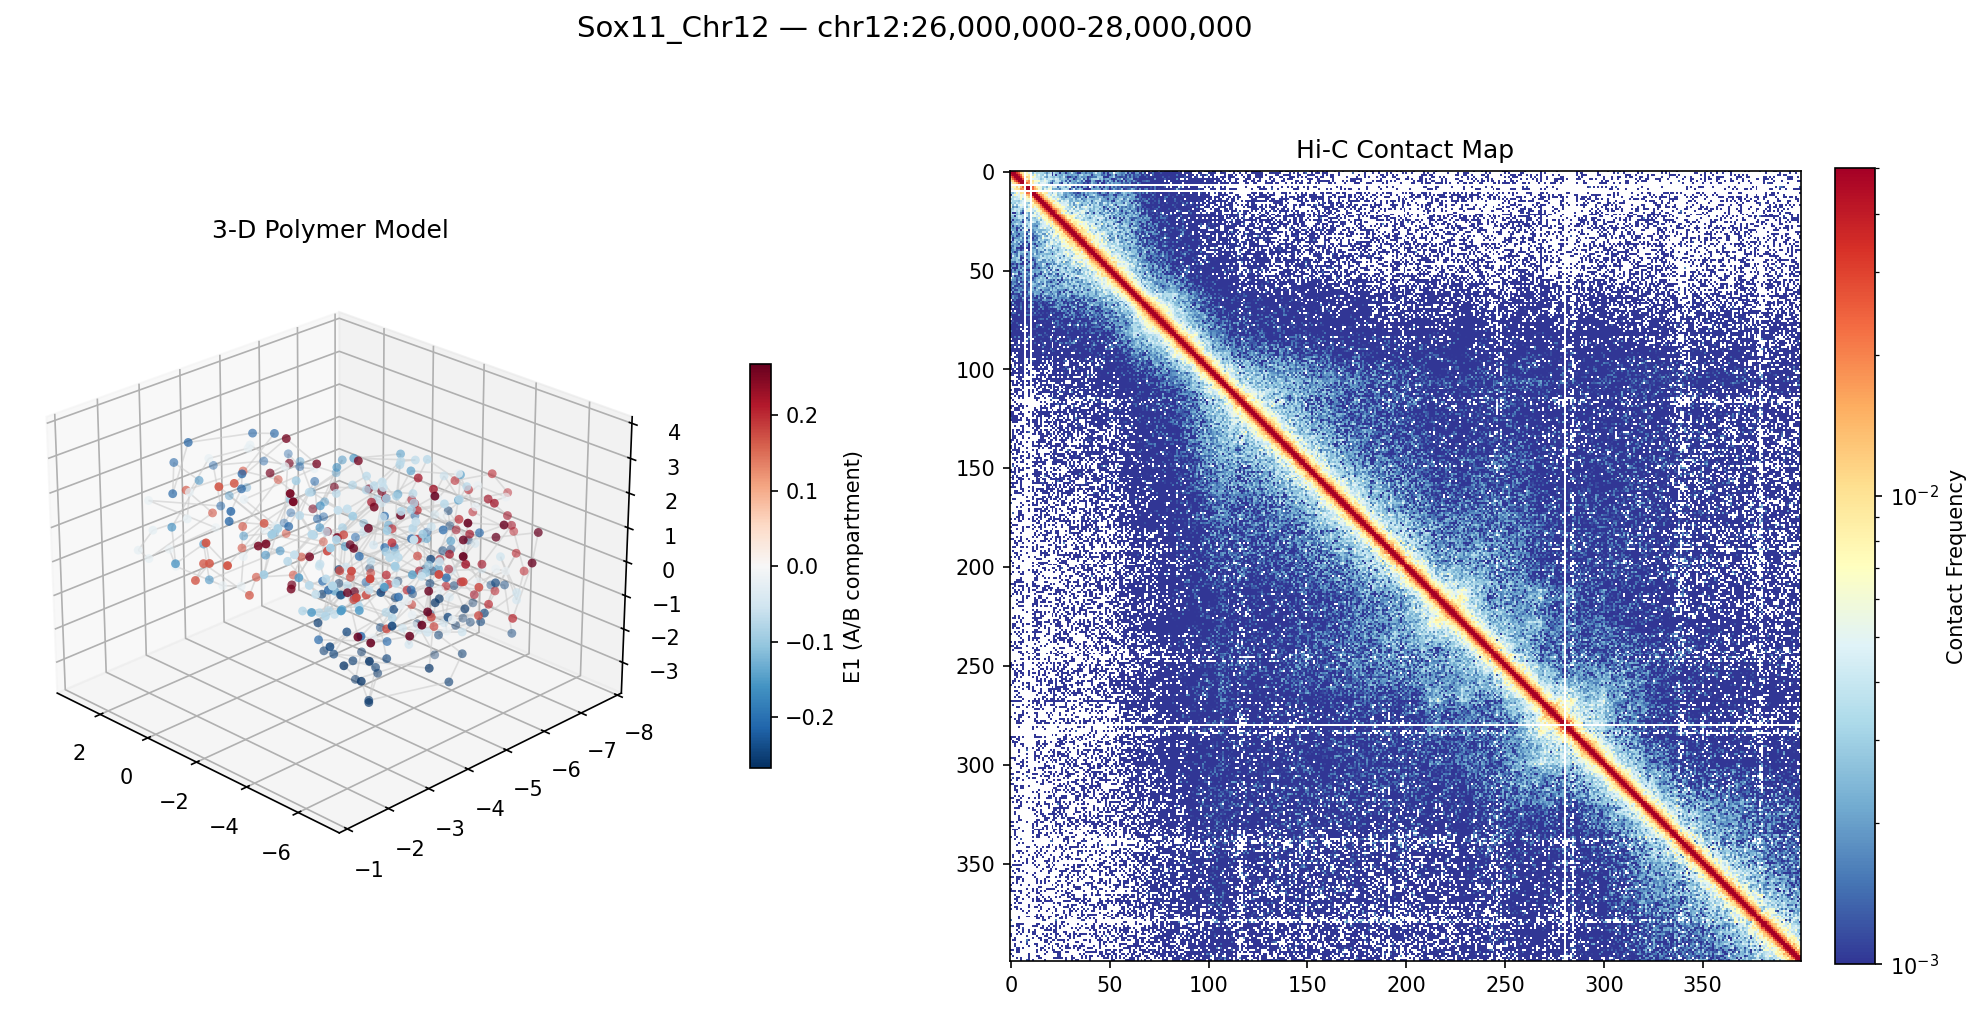
Contact frequencies encode 3D proximity, so it’s possible to work backwards: given a Hi-C contact matrix, what does the chromatin fiber actually look like in 3D space? The library includes a pure NumPy/SciPy polymer simulation engine (no OpenMM or external molecular dynamics dependencies) that converts contact matrices into harmonic spring restraints and integrates overdamped Langevin dynamics to produce 3D bead coordinates. Beads are colored by A/B compartment identity—red for active (A) compartment, blue for inactive (B)—so the simulation simultaneously reveals both the 3D folding and the epigenetic landscape.
AlphaGenome: In-Silico Deletion Analysis
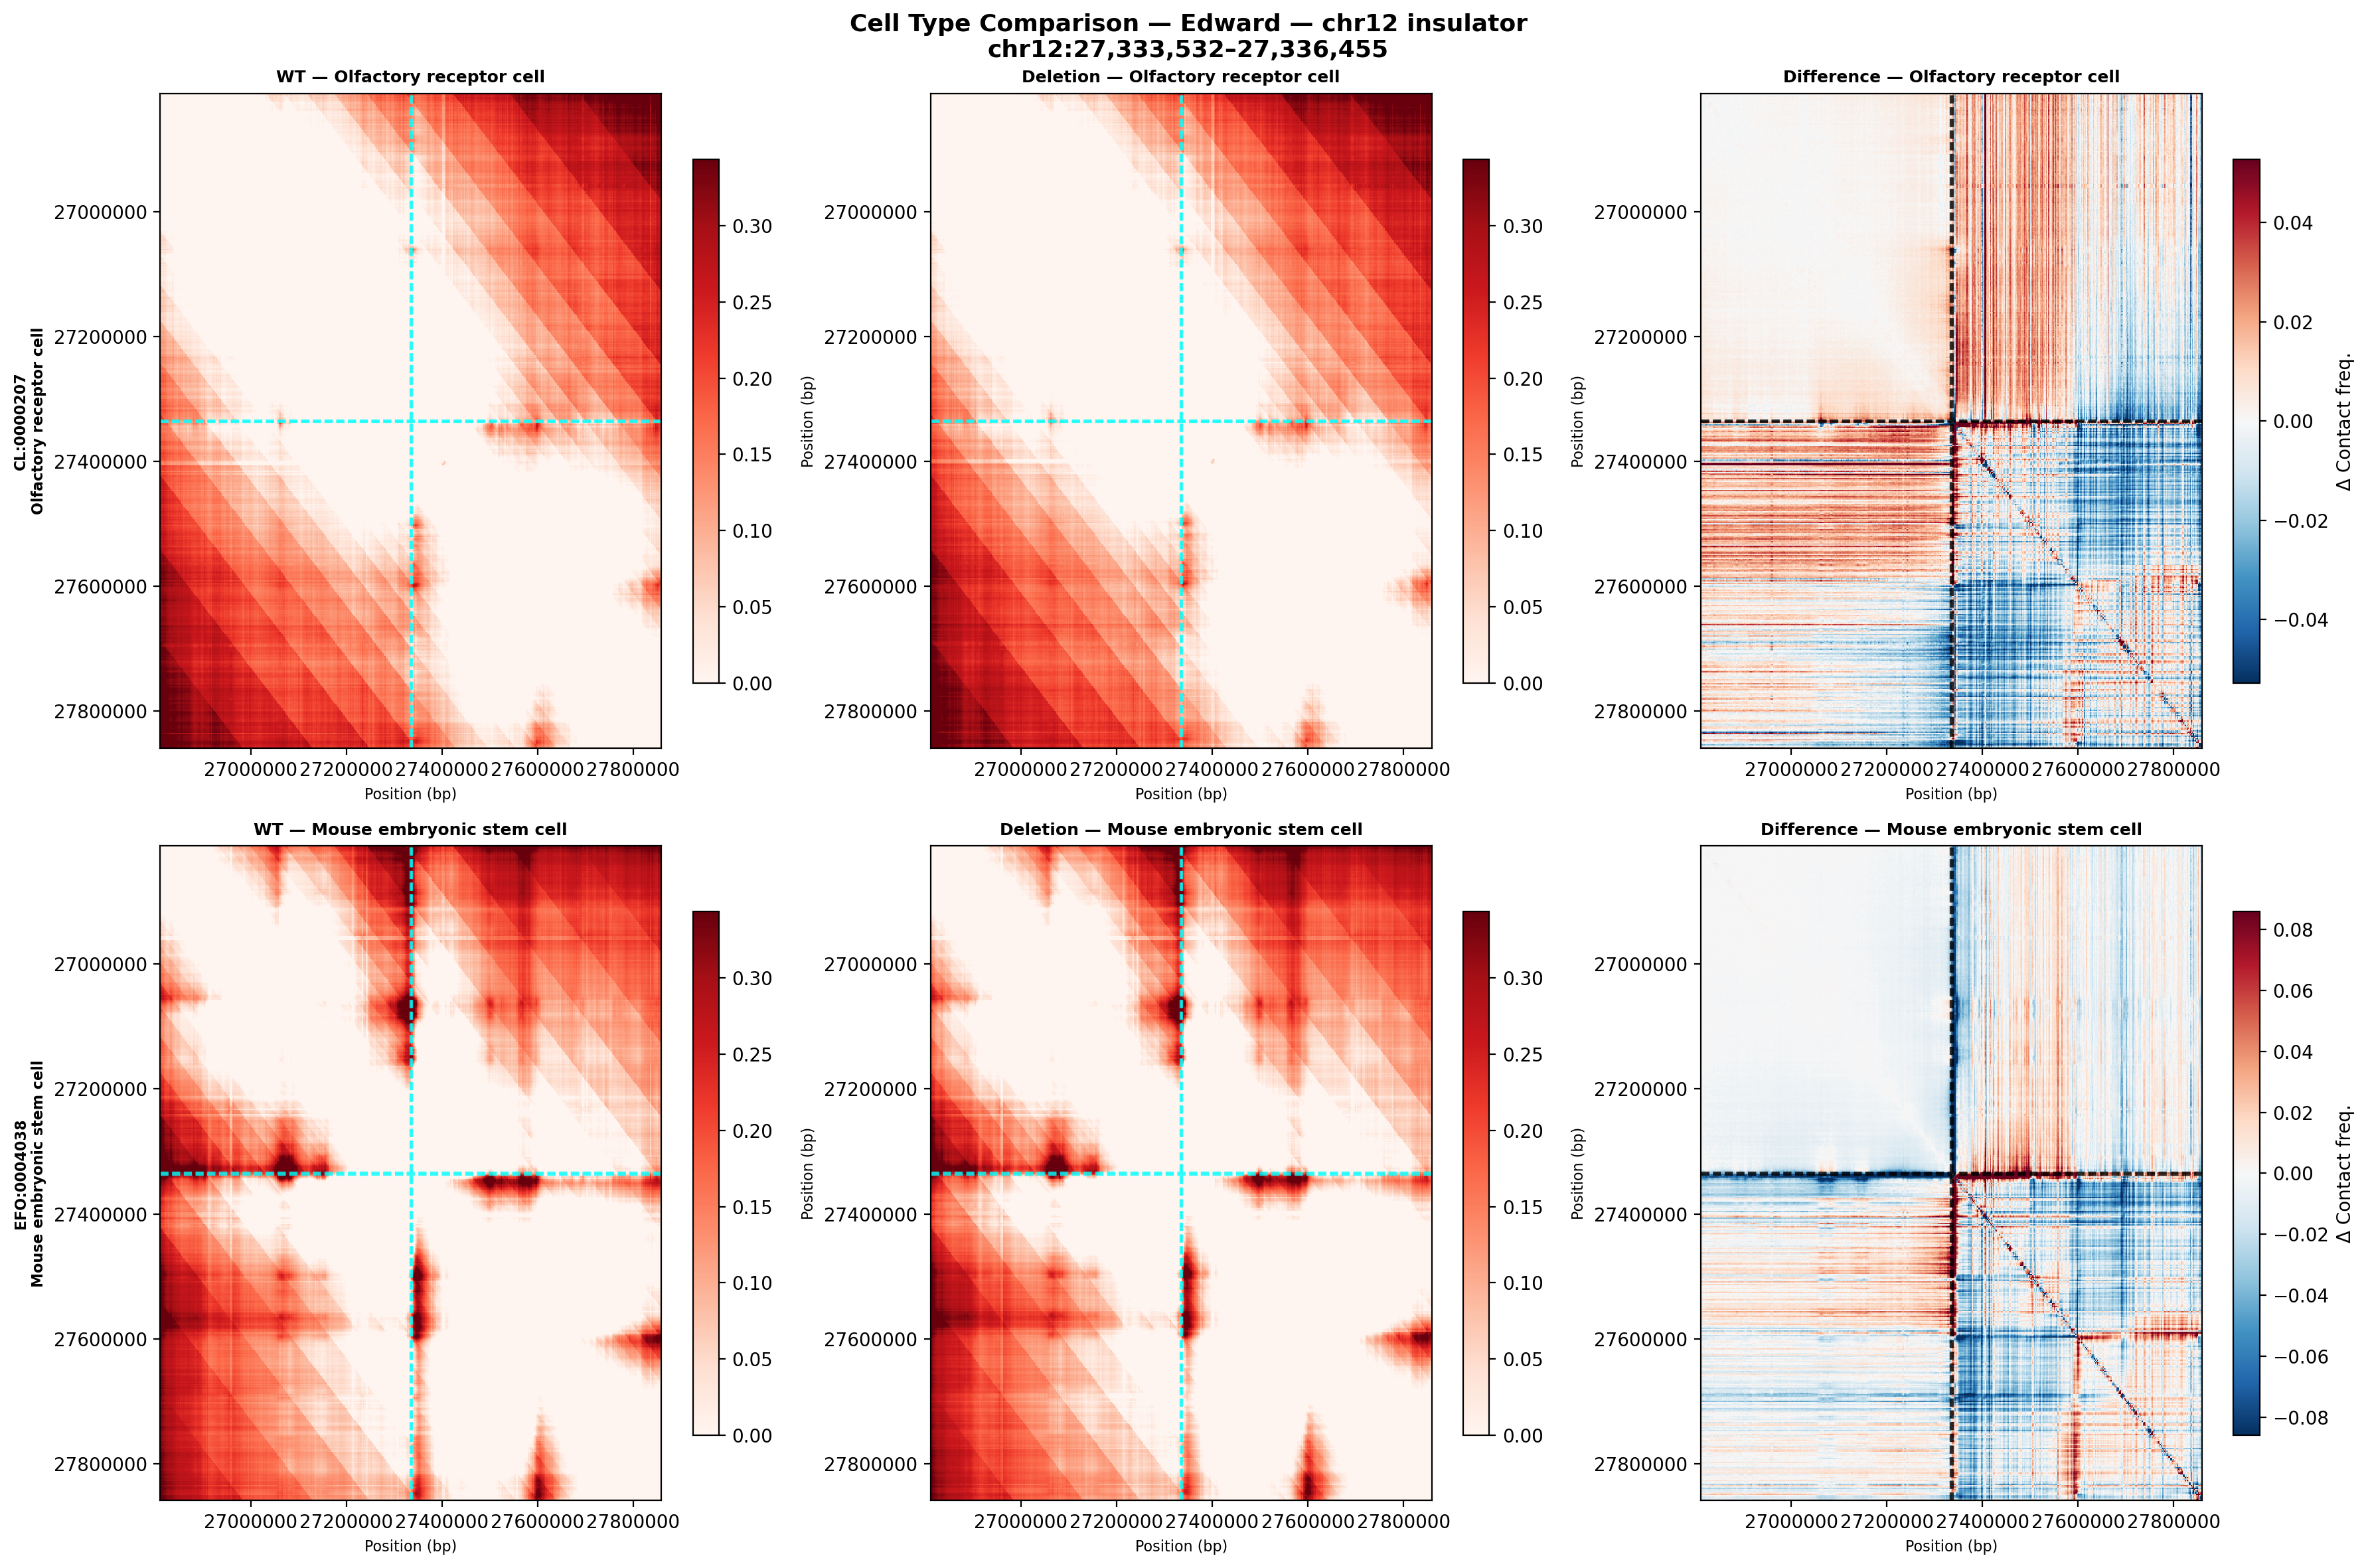
The most technically demanding component: using Google DeepMind’s AlphaGenome model to predict what happens to chromatin architecture when a specific genomic sequence is deleted. The 6-panel figure above compares wild-type vs. deletion contact maps (and their difference) for Edward’s chr12 insulator in two cell types—olfactory receptor cells (top) and mouse embryonic stem cells (bottom). The difference maps (right column, red = gained contacts, blue = lost contacts) show how the deletion reshapes the contact landscape.
This required integrating the AlphaGenome SDK, querying predictions for 1 Mb genomic windows, substituting deletion sequences, and computing delta contact matrices—essentially simulating a CRISPR experiment computationally before it’s done in the lab.
Deletion Sensitivity Scanning
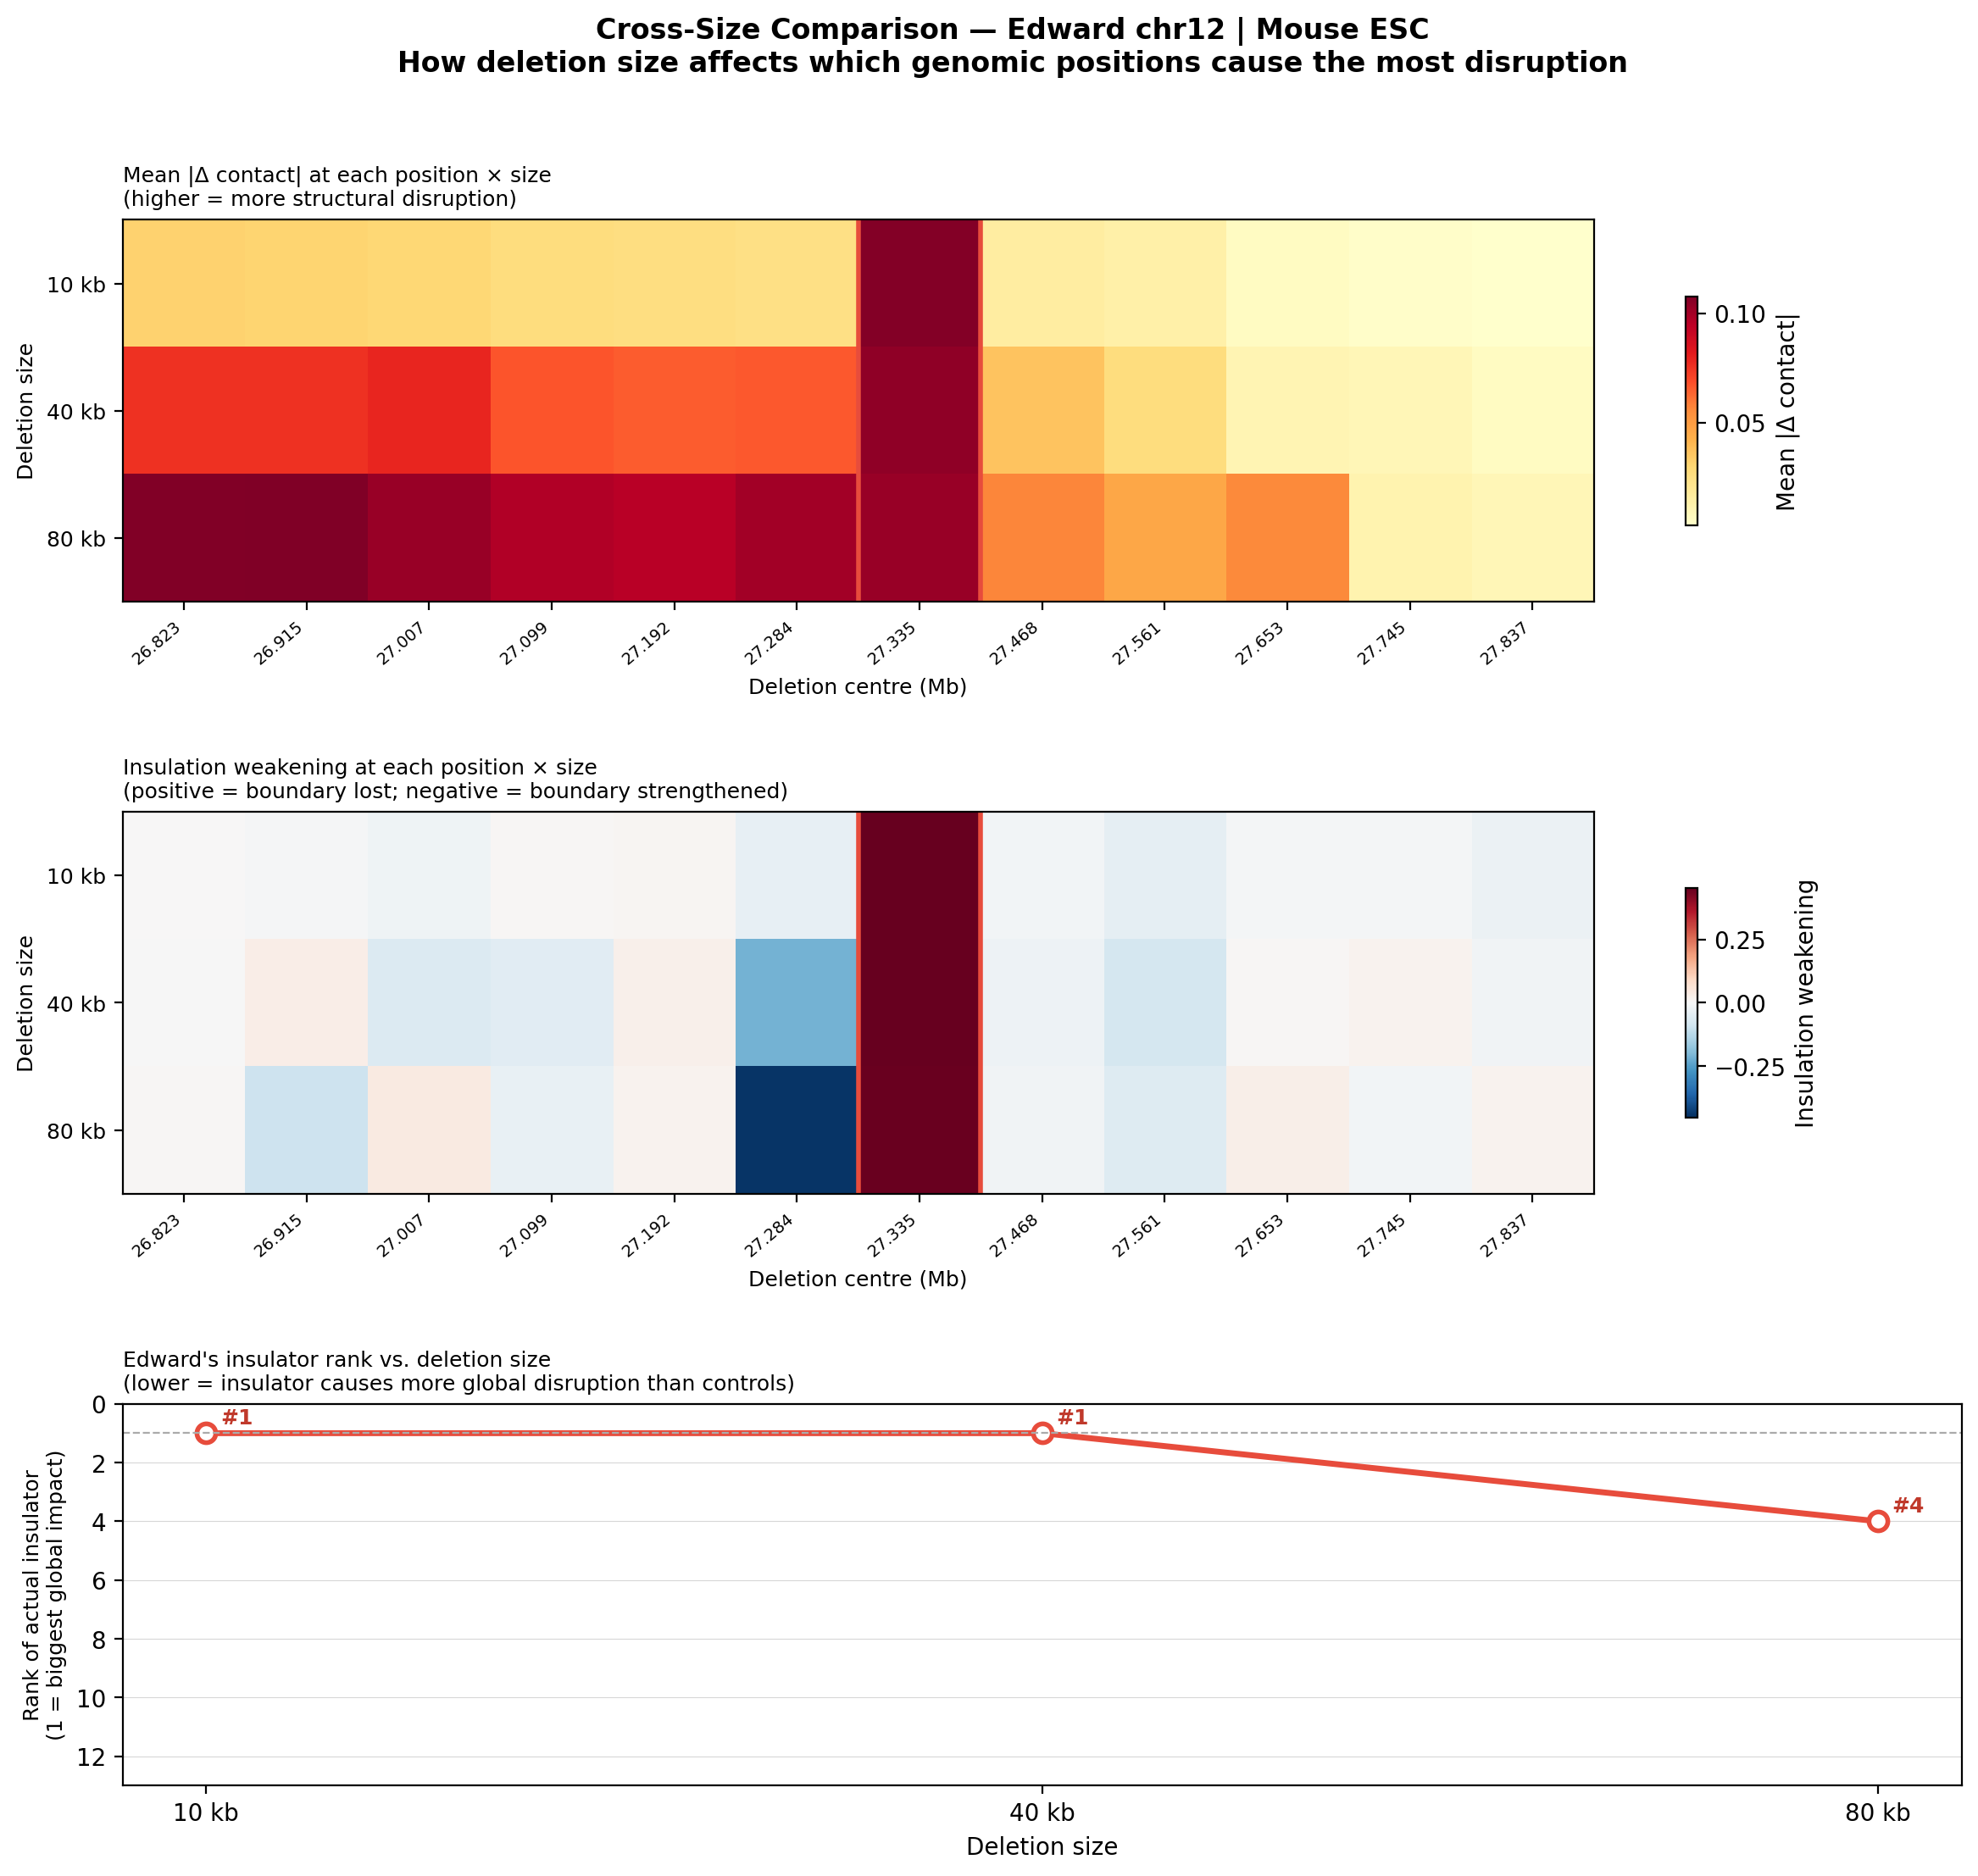
Rather than just asking “does deleting this element disrupt the TAD?”, the library runs a systematic sensitivity scan: 12 deletion positions × 4 deletion sizes (3 kb, 10 kb, 40 kb, 80 kb) across the Edward chr12 region. Each position is ranked by how much structural disruption it causes relative to controls.
The key finding: Edward’s insulator ranks #1 most disruptive at 10 kb and 40 kb deletion sizes—meaning it causes more global contact disruption than any of the 11 flanking control positions. This size-dependent effect suggests the insulator element has a larger functional footprint than the original 3 kb deletion implied, information that would be invisible without this kind of systematic computational scan.
Synthetic Enhancer Design
Beyond analysis, the library includes a CNN-based pipeline for designing novel enhancer sequences from scratch:
- Structural nomination — Hi-C contact patterns identify candidate enhancer bins with long-range interaction signatures
- CNN training — A convolutional neural network is trained on real AlphaGenome ATAC-seq accessibility predictions to learn the sequence features of active enhancers
- Gradient optimization —
scipy.optimizeevolves sequences to maximize predicted ATAC accessibility while maintaining biological constraints (GC content, codon usage) - Motif insertion — Transcription factor binding motifs (Sox11, AP-1, NeuroD1) are inserted and the flanking sequence refined; the Sox11 motif improved scores by +0.009 to +0.050 per sequence
- AlphaGenome validation — Designed sequences are substituted back into their genomic locus context and re-evaluated with AlphaGenome as an independent model
Best CNN score achieved: 0.8155 on predicted ATAC accessibility; best final design: 0.7758 (from a real top candidate at 0.764).
Technical Details
- Data format —
.cool/.mcoolmulti-resolution Hi-C files via thecoolerlibrary - TAD algorithms — Insulation score (Crane et al. 2015), Directionality Index (Dixon et al. 2012), prominence-based boundary calling with Li’s cross-entropy auto-thresholding
- Polymer simulation — Pure NumPy/SciPy overdamped Langevin dynamics, no external MD dependencies
- AI integration — AlphaGenome SDK (Google DeepMind) for contact maps, CTCF binding, ATAC accessibility, histone mark predictions
- Machine learning — PyTorch CNN trained on AlphaGenome-derived ATAC labels
- Analysis modules — TAD calling, A/B compartments, chromatin loops, HiChIP, Capture Hi-C, structural variant detection, CNV analysis, haplotype phasing, variant effect prediction
- Test suite — 70+ unit and integration tests (pytest)
- Dataset — Mouse Micro-C, mm10, 5 kb resolution, 4DNucleome