
NOSTRADAMUS — NJ Geospatial Intelligence Platform
Most mapping tools show you where things are. NOSTRADAMUS shows you what’s happening—and what it means. It’s a real-time geospatial intelligence platform built for New Jersey that fuses 3D city simulation, live aviation tracking, and deep economic data into a single interactive environment. Whether you’re analyzing unemployment patterns across counties, tracing commercial flight paths over a neighborhood, or exploring a city block in Night Vision mode, NOSTRADAMUS makes the invisible visible.
Demo
Why hasn’t this been done before?
Building a platform like this requires solving three hard problems at once: real-time data fusion, 3D rendering at scale, and meaningful interactivity. Most GIS tools are either locked to 2D, require expensive enterprise licenses, or offer data without context. Connecting live FAA flight feeds, BLS economic datasets, census data, FEMA flood maps, and utility grid layers—then rendering all of it in an interactive 3D environment—demands careful architecture and thoughtful design decisions at every layer.
The hardest part isn’t getting the data. It’s making the data feel alive. A choropleth map of unemployment rates is useful. That same map overlaid on a 3D rendered city you can fly through in Drone mode, switching to Night Vision to isolate infrastructure—that’s a different kind of understanding.
A Platform Built Around Exploration
NOSTRADAMUS is organized around two modes: 3D Simulation and Data Intelligence.
3D Simulation Mode
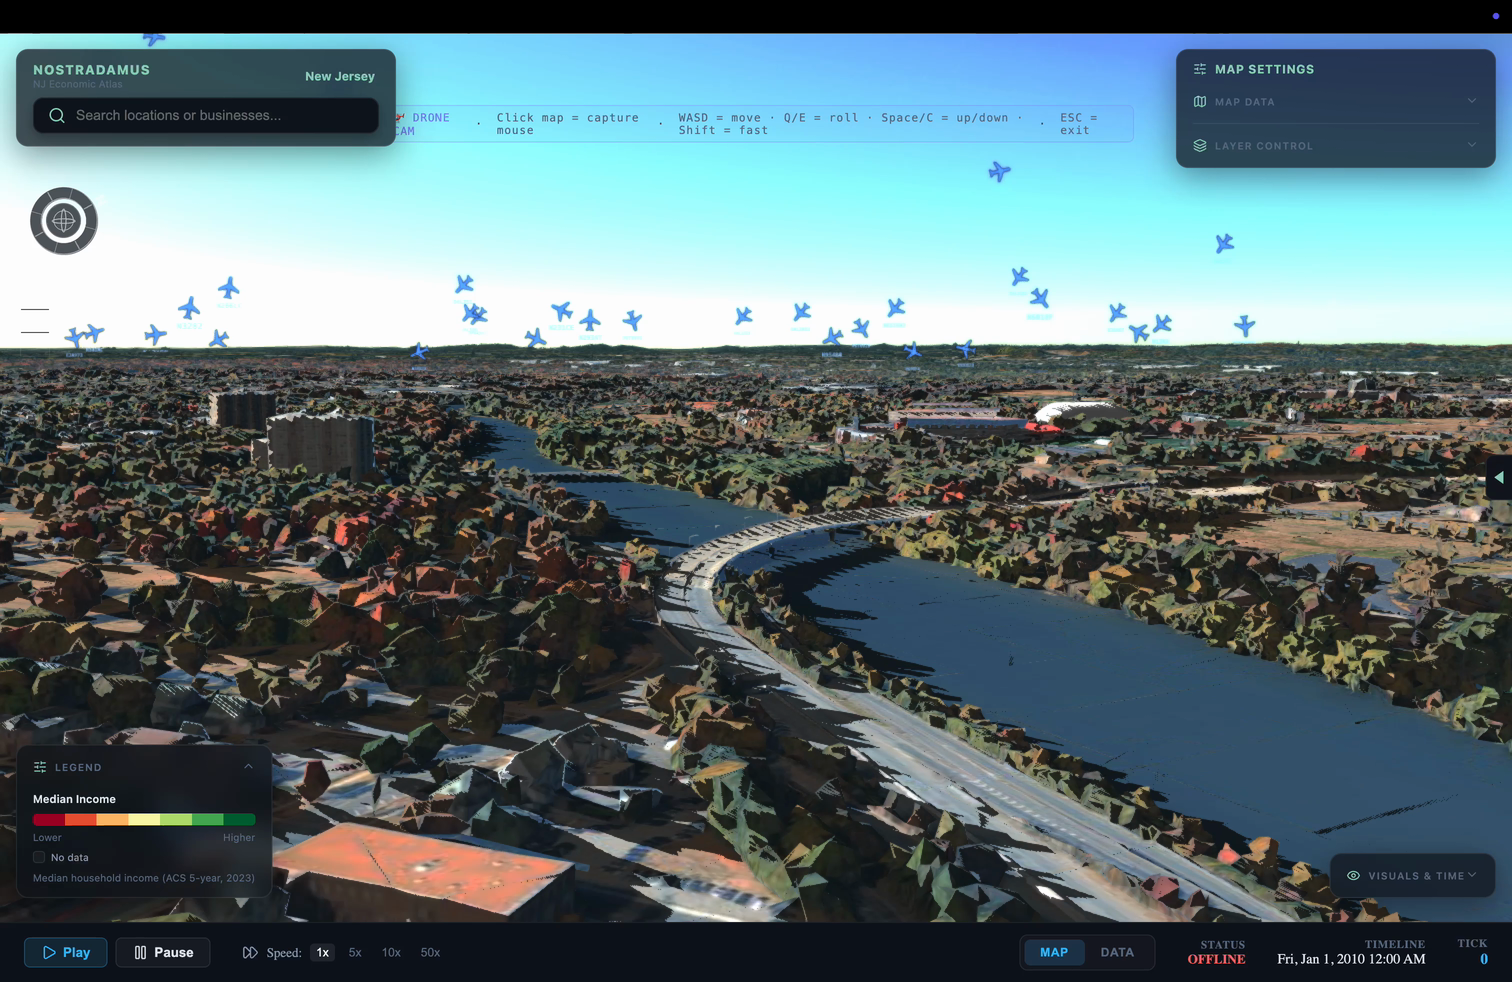
The 3D view renders New Jersey with full building extrusion, color-coded by Median Household Income (ACS data). Live commercial and military flights are overlaid as animated icons using real-time aviation data. A Drone Flythrough camera mode lets you navigate the environment with full 6-degrees-of-freedom controls (WASD + Q/E + Space/C), and a time simulation engine lets you scrub through historical periods starting from 2010 at speeds up to 50×.
Key features:
- Visual Rendering Modes — Default, CRT, Night Vision, FLIR, Noir, Anime, Hi-Contrast
- Sky Modes — Sunny, Cloudy, Dusk, Night with accurate lighting
- Camera Views — Overview, Panoptic, Tactical
- Live Aviation — Commercial flights + military tracked separately with toggle controls
Night Vision & FLIR
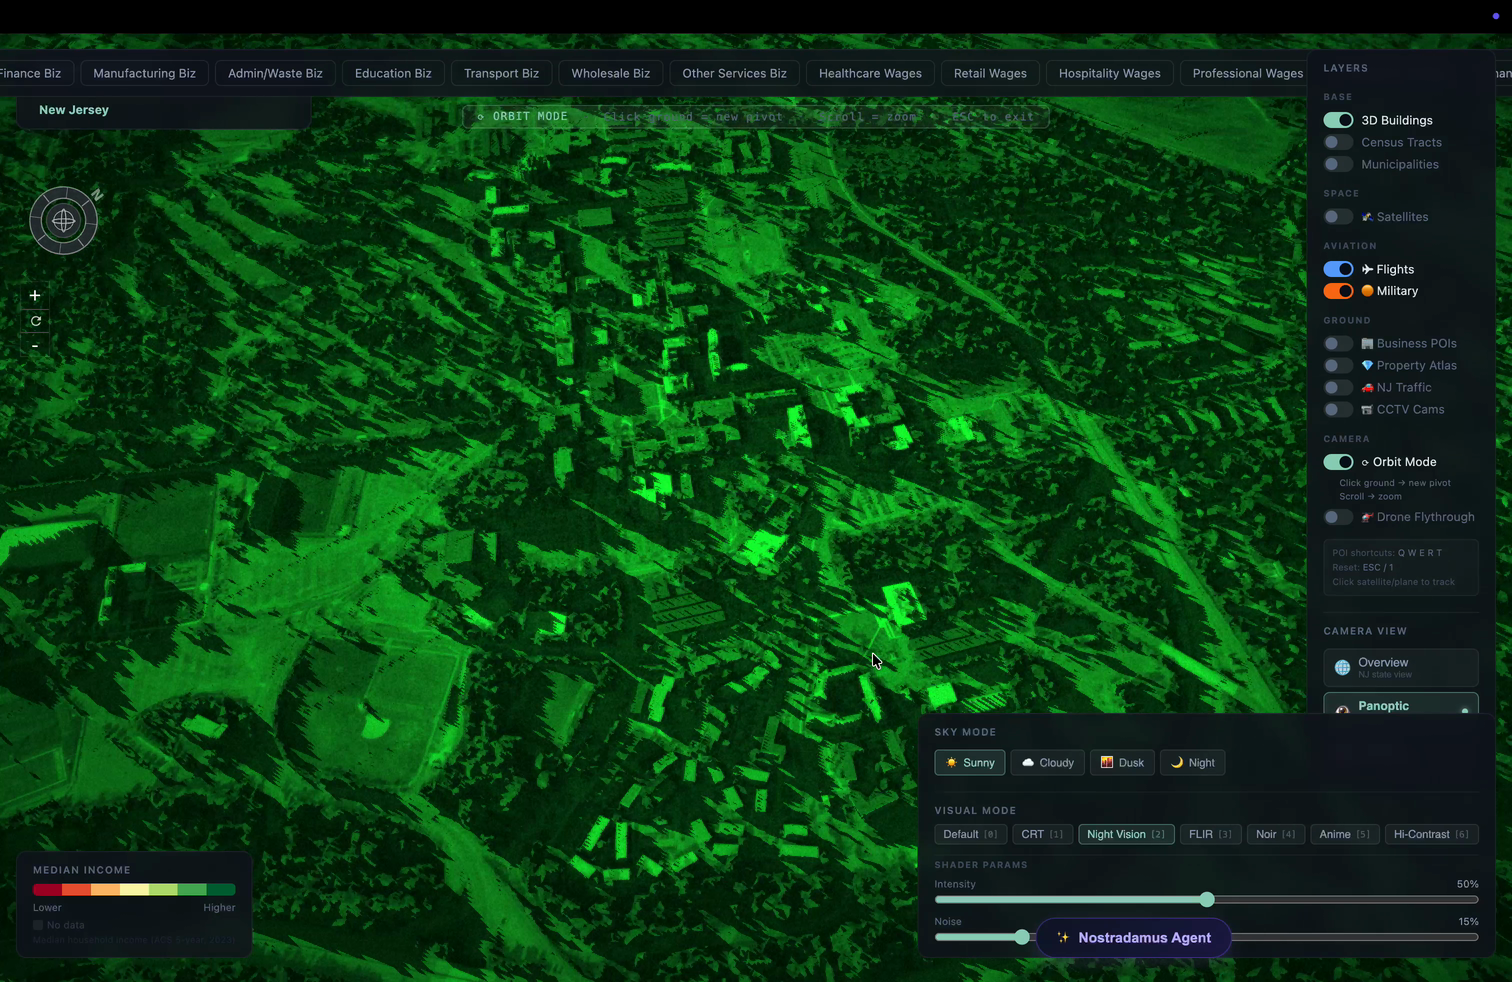
Switching rendering modes transforms the entire environment in real time. Night Vision renders the scene in classic green phosphor. FLIR mode produces high-contrast thermal imagery. These aren’t just visual gimmicks—they’re designed to surface different spatial patterns in the underlying data.
Data Intelligence Mode
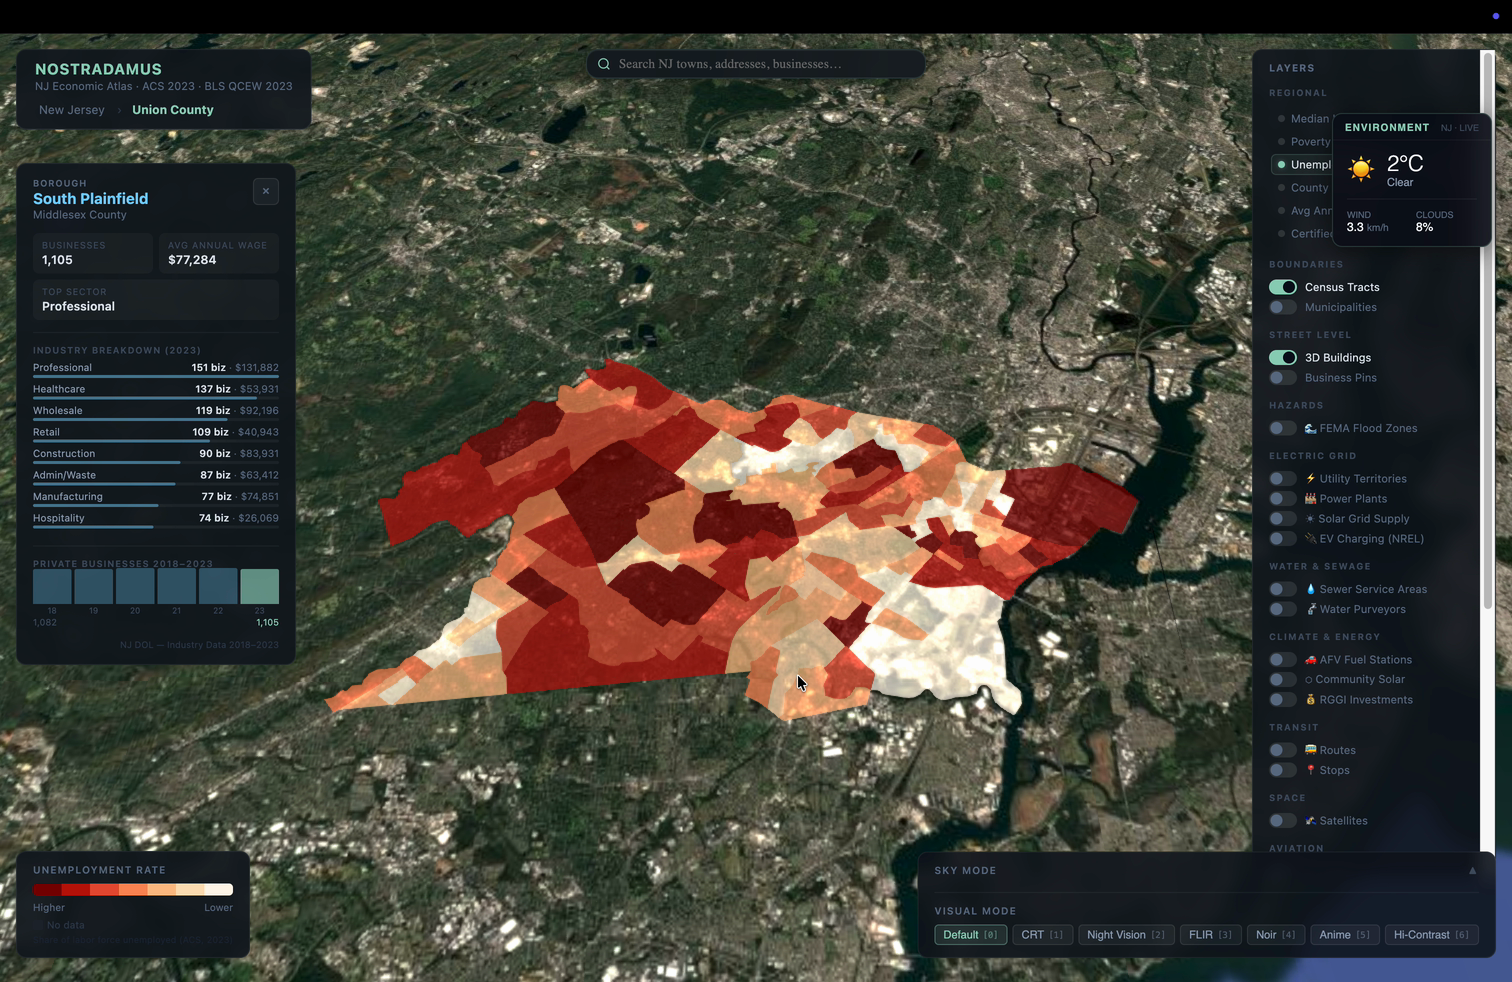
The data mode switches to a satellite base map with an extensive layer system organized by category. Clicking any municipality or census tract surfaces a detailed panel showing:
- Population, Median Income, Poverty Rate, Unemployment
- Industry breakdown by sector (# of businesses + wages)
- Private business counts over time
Regional layers include:
| Category | Layers |
|---|---|
| Economic | Median Income, Poverty Rate, Unemployment Rate, Avg Annual Wage, Certified Businesses |
| Boundaries | Census Tracts, Municipalities |
| Hazards | FEMA Flood Zones |
| Electric Grid | Utility Territories, Power Plants, Solar Grid Supply, EV Charging (NREL) |
| Water & Sewage | Sewer Service Areas, Water Purveyors |
| Climate & Energy | AFV Fuel Stations, Community Solar, RGGI Investments |
| Transit | Routes, Stops |
| Aviation | Flights, Military |
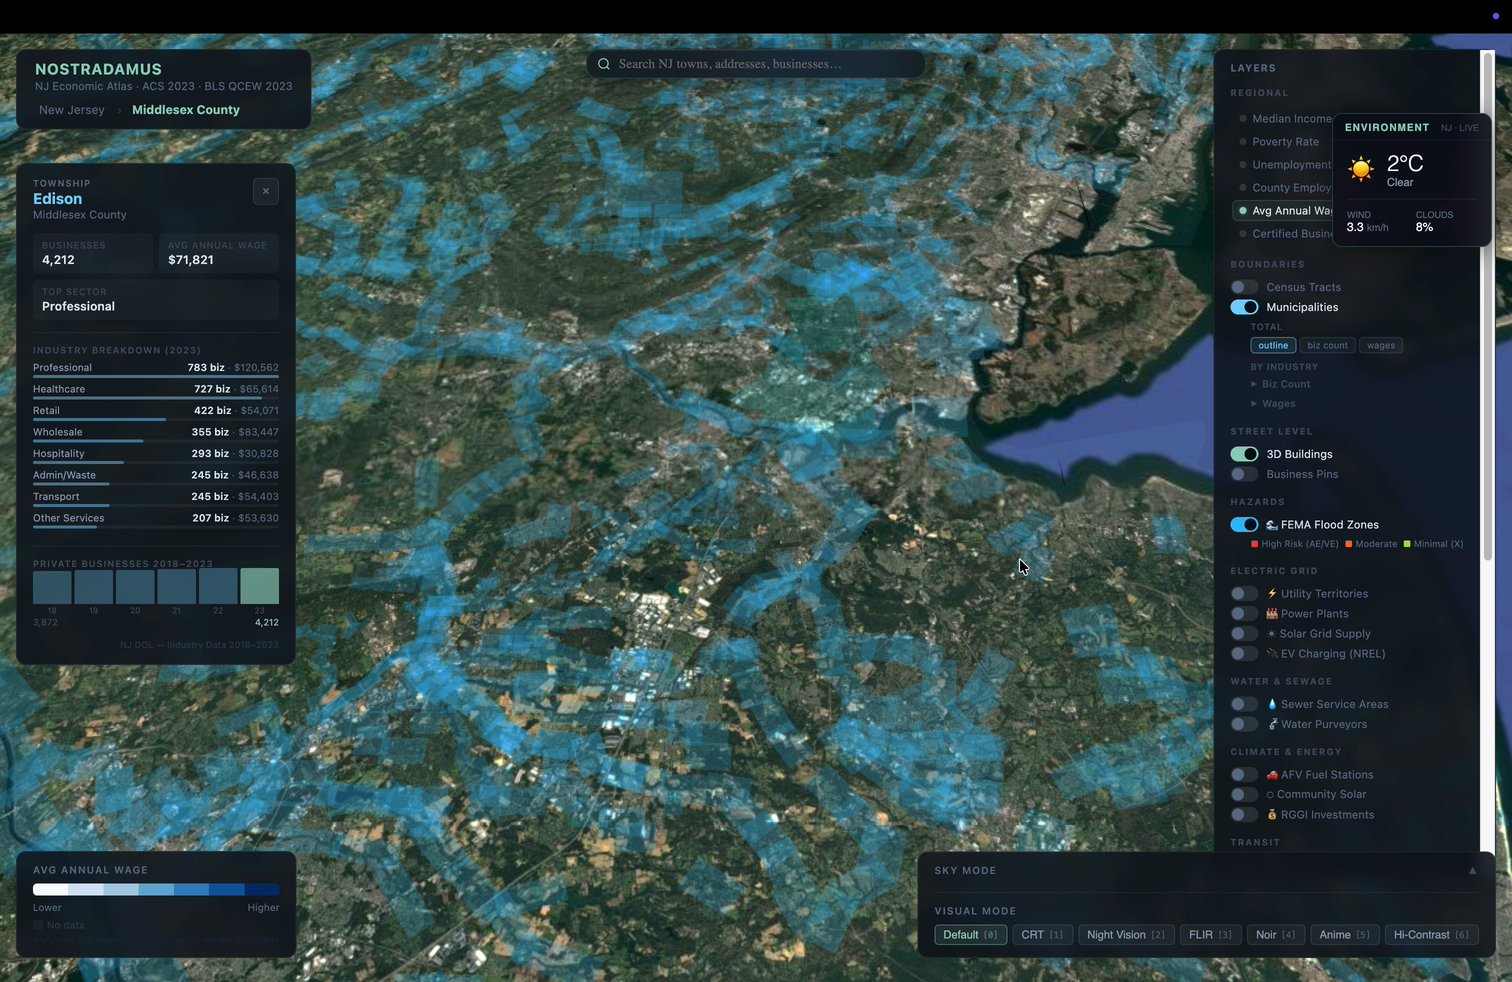
Data is sourced from NJ Economic Atlas, ACS 2023, BLS QCEW 2023, FEMA, and NREL—all fused into a single queryable layer system.
The Technology
- 3D Rendering — WebGL-based engine with real-time building extrusion and lighting
- Data Sources — NJ Economic Atlas · ACS Census · BLS QCEW · FEMA · NREL · FAA
- Aviation — Live flight data with separate commercial/military layer toggles
- Time Engine — Historical simulation playback from 2010 at variable speeds
- AI Component — Nostradamus Agent for natural language queries over the data